Now That Commodity Prices Are Coming Down…

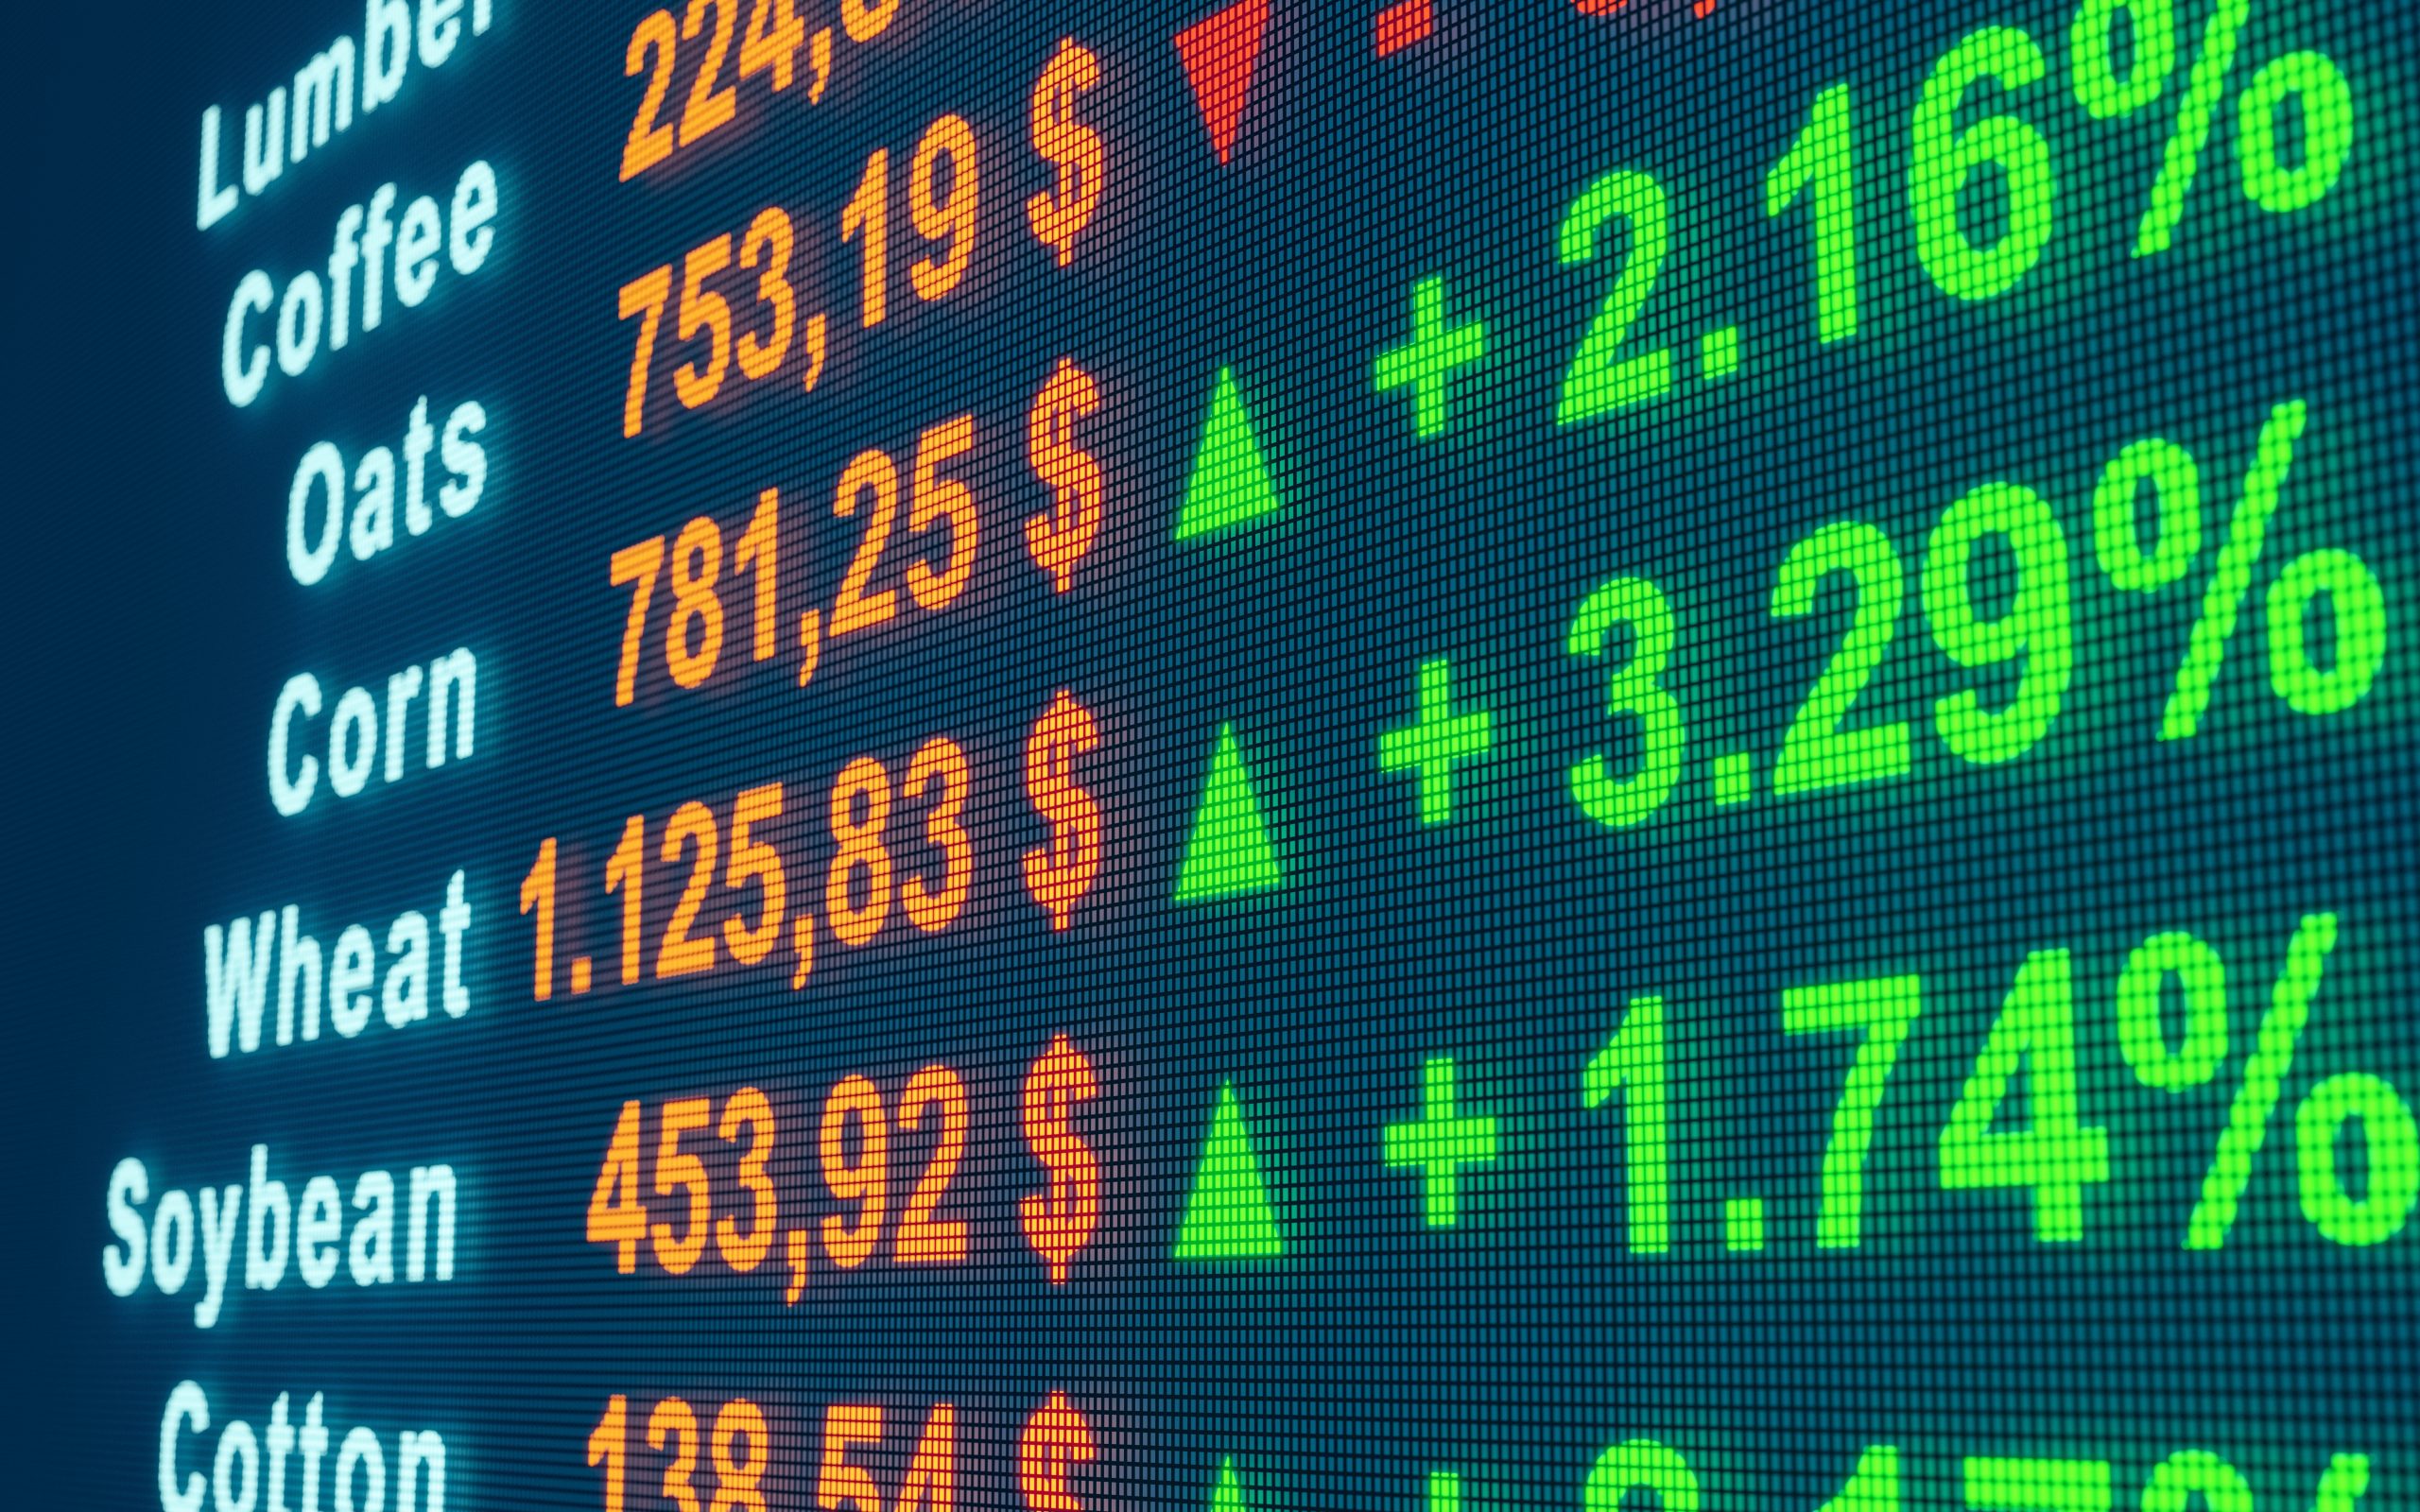
 After many months of angst about rapidly rising commodity prices, indications are that they are coming back down. This presents an opportunity for a data-driven business that uses advanced analytics. Though there is pain in operating a supply chain under extreme raw material conditions, volatility in data helps models better understand relationships.
While dealing with commodity prices and availability happens at the front end of a company’s supply chain, the impact flows all the way through to the forecasting of consumer demand and response to price changes. This means that there needs to be an integrated data and modeling approach. This is rare; very few companies treat end-to-end supply and demand holistically, even when they call it integrated demand/supply planning.
The first step in taking a better analytical approach is to obtain more data and consolidate it within a data framework that aligns with the flow of the supply chain. Peter Norvig, the director of research at Google, famously said, “we don’t have better algorithms than anyone else. We just have more data.“ While companies are good at measuring sales and shipments, many do not integrate commodity data.
The second step is to apply the right kind models (statistical or machine learning). This can be challenging. The regression model you learned about in college will not cut it. In the case of supply chains, models need to understand lag structures across nodes. In other words, determining how a change in an upstream node propagates, both with respect to timing and magnitude, as the impact flows through. Segmentation tools are also helpful, as impacts can differ and can be classified.
This kind of analytics can be hard to do, as commodity prices themselves are difficult to forecast. Honestly, if First Analytics found the secret to highly accurate commodity price forecasting, we would play the commodities market directly ourselves! But through what-if simulations, ranges of reasonable predictions, where the relationship is measured between prices and supply chain outcomes, can be estimated. See for example, this case on producer profitability, and this one on customer demand.
The upside of volatility is the creation of data that sheds light about a broader set of conditions. New history is being created and it is great time to record and model that history.