Railroad Car Loadings are Down But It’s Not All Due to COVID-19
The railroads are a great indicator of the strength of the economy and nobody monitors rail traffic more than the American Association of Railroads (AAR). Their weekly rail traffic reports are watched closely, even when extreme stresses to the economy are not present.
Year-over-year comparisons (“YOY”) are common — we all do it to gauge the strength of our businesses. But there can be flaws in this approach. For example, the AAR reports, such as this one, state numbers as “compared to the same week in 2019.” In this particular case, carloads were down 16.2%. It is tempting for reporters to jump onto that number and immediately infer that this is all due to the pandemic. But this does not take into account the fact that carloads have been on a slow but steady decline since the second half of last year. Had there been no pandemic there still would have been a decrease.
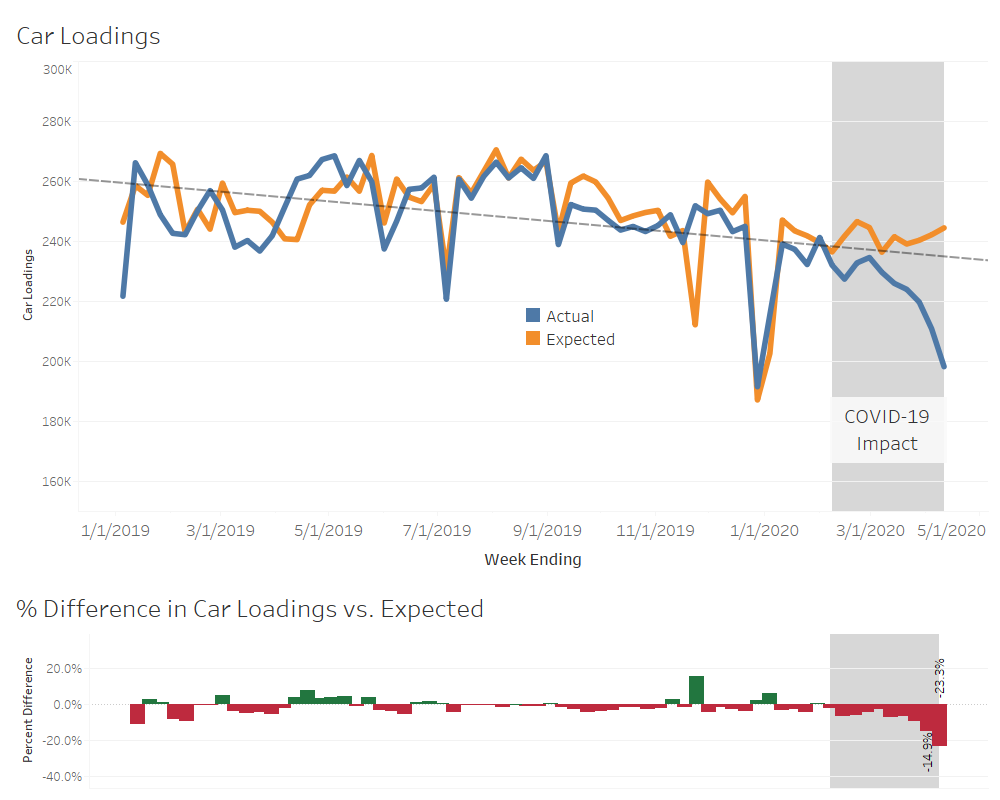
One way to partition out the YOY change is to use predictive modeling to estimate what might have been expected under normal circumstances. In this case, we can use it to give us a benchmark of what carloads might have been, accounting for that gradual decline, had the pandemic not happened. We can have the model take this historical data up until a date where the pandemic had yet to make an impact, and forecast those trends forward. Then, we can compare the actuals vs. “what might have been” to help us roughly gauge the impact.
In the chart, one can see the divergence of the actual versus expected lines, once the impact was beginning to be felt in February. As an example, the AAR reported that carloads were “down 16.2 percent compared with the same week in 2019.” The difference between the model and actual is 14.9%. That difference of 1.3 percentage points could likely be attributed to the slowing of demand generally.
Other approaches involve modeling the impact directly by bring COVID-19 related data directly into the models. We have developed our own county-level case prediction model, for example, which we can marry with other data such as business volume or employee attendance (we make this prediction data available for free for companies who can use it).
Most of our clients, across multiple industries, are grappling with extremely altered business volume patterns that they have never seen before. And while this a simple, perhaps trivial example, now more than ever we need data and analytics to help us in business resiliency and recovery.