Using Predictive Analytics to Improve Safety for Employees

In recent years, Chief Safety Officers, Risk Officers and line managers have undertaken a variety of programs to improve safety in their workplaces—whether on a construction site, on a shop floor, in a train yard or on a drilling platform, there has been no shortage of effort in improving safety.
This is good news for employees and companies alike, with reductions in fatalities (from 4.2 per 100,000 employees in 2006 to 3.6 per 100,000 employees in 2016) and workplace injuries that result in medical treatment, lost work or restricted work activity (from 4.2 per 100 employees in 2006 to 2.9 per 100 employees in 2016).[1]
Moving Beyond the Current Plateau
With these programs becoming part of the way these businesses operate–from improved incident visibility, new structures for investigating and reviewing occurrences, and the proliferation of dashboards to create focus—there have been investments and strides made, with an enhanced culture of Safety being developed along the way.
The expanding use of measurement and availability of metrics, being “data-driven” has been encouraging and an important enabler in this progress.
But, where can we find the next benefit?
What does that look like?
How can we breakthrough and go beyond the current plateau?
We need to get beyond the data that represent backward-facing numbers to future-focused measures that address the Safety question holistically. Being predictive, by identifying Safety incidences in advance with a degree of probability, moves these Safety programs from reactive to pro-active; from “data-driven” to “analytically-driven”.
From data-driven to analytically-driven
Data is data is data…it is inanimate, it gains usability when contextualized in dashboards as a count of occurrences (e.g. number of incidences), and perhaps a calculation of such (% of all incidences of a certain type, etc.). This is very useful in gaining understanding and identifying areas of possible focus. “We’re focusing on reducing incidences in a particular location, since that location represents 62% of all Safety incidences”. This is good! A location is prioritized, deeper investigation occurs, human assessments are made, action is taken towards future improvement. Having the baseline measures, we can now measure our improvement based on our actions. A virtuous cycle of on-going improvement.
Analytics, specifically predictive analytics, provide an actionable means for forward-looking benefit, now. Using data as building blocks, analytics bring forward statistical methods that evaluate and calibrate factors and make correlations of past incidences to foreshadow future occurrences. By using statistical methods, bias is reduced in evaluating the factors that have caused incidences, as well as sling-shots that knowledge forward to identify the areas of high probability incidences in the future.
These well-worn predictive methods — used in industries ranging from retail to banking to agriculture, applied in forecasting product demand to managing supply chains to making product recommendations – make your data “smart”.
Whether looking at employee factors, environmental considerations or equipment reliability, predictive analytics can help move beyond “what has happened” to “what will happen”.
Where the Rubber-Meets-the-Road
Companies are using predictive analytics to improve Safety, a few examples:
- Employee Safety: Addressing questions about which factors are present when incidences occur — including evaluating employee schedules, including how much, and which specific training has been attended — evidence-based recommendation can be made;
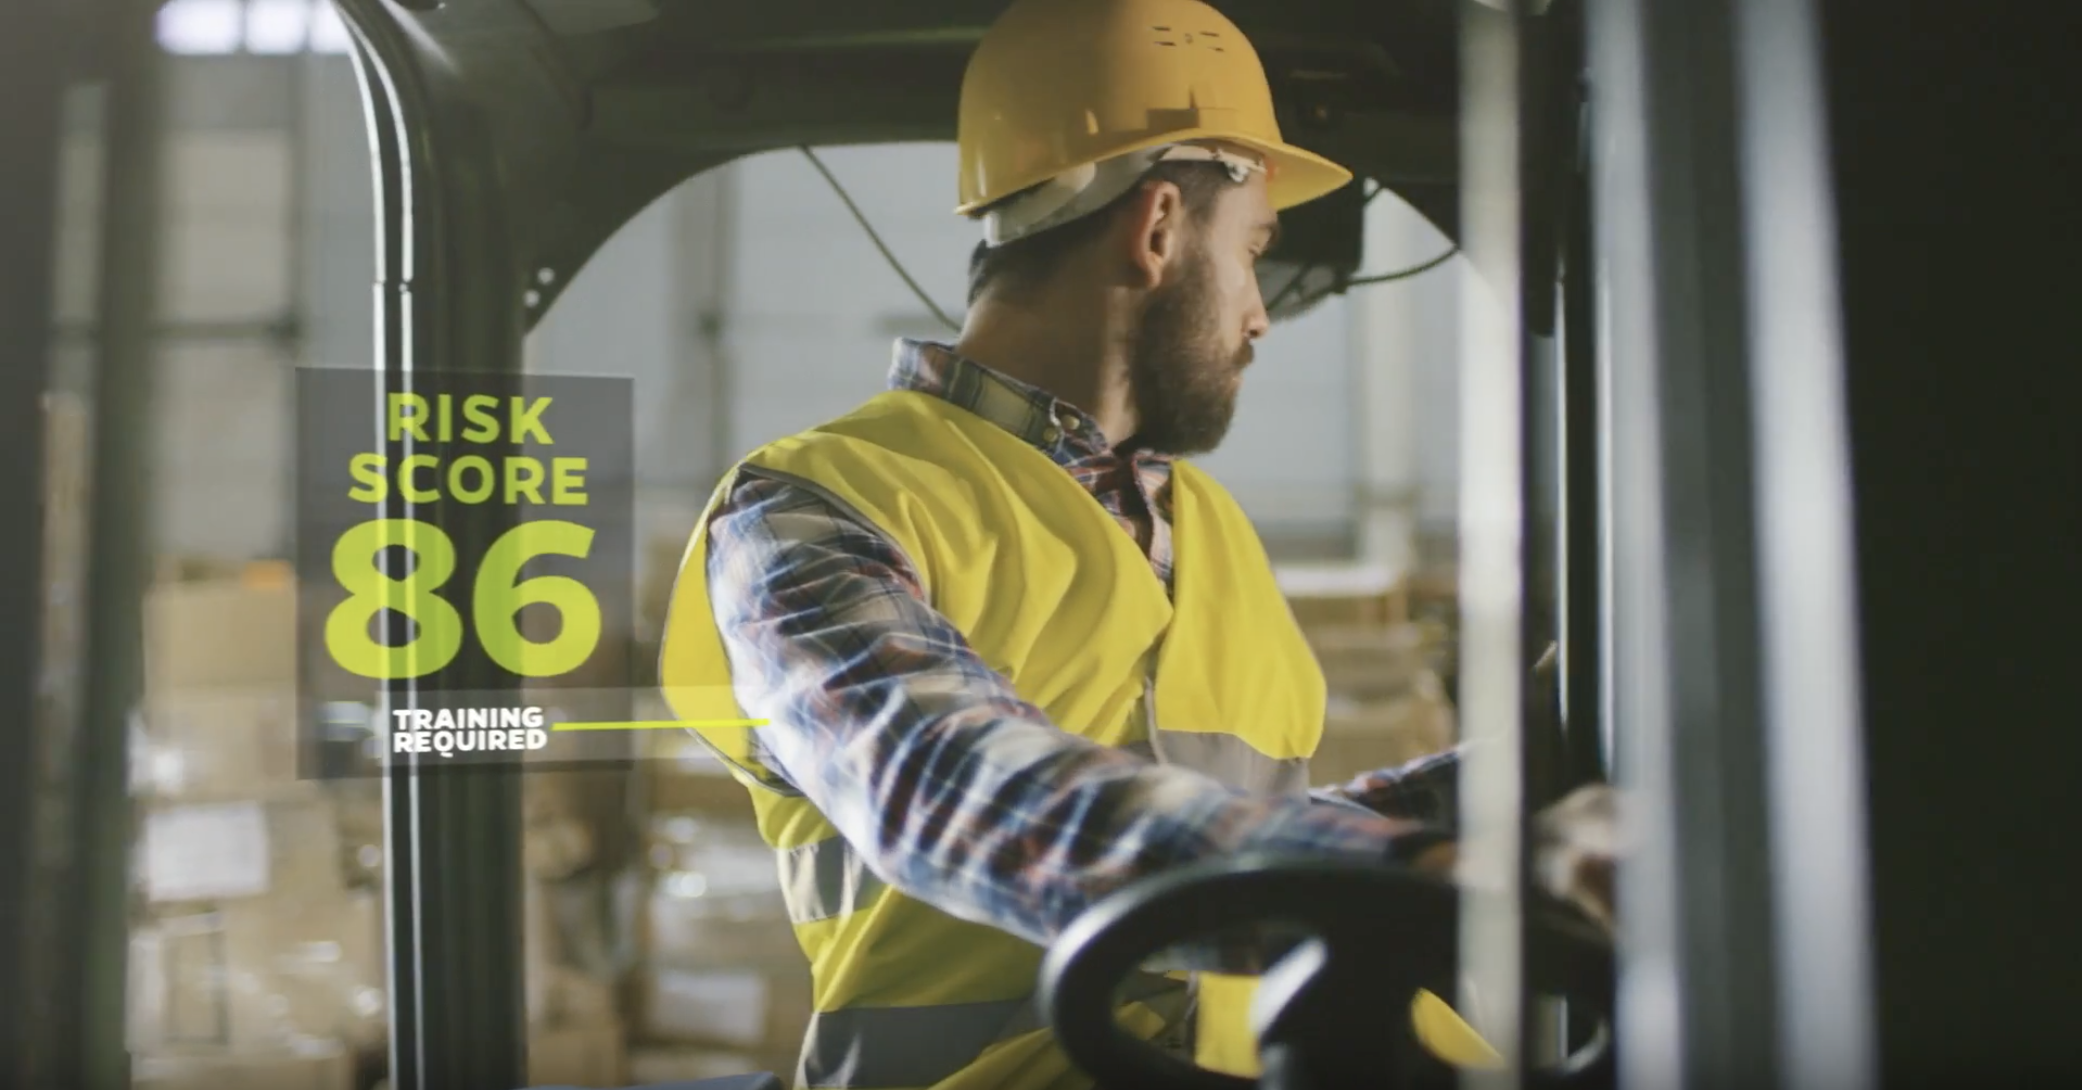
Several major railroads are using predictive analytics to identify employee-focused factors and at-risk employees for further training, for taking preventative actions or addressing impactful behaviors.
- Equipment Safety: Including in the analytic approach equipment maintenance histories, what service is required when, as well as which incidences have been tied to specific equipment allows us to take pre-emptive action;
A manufacturer of large construction equipment is using predictive analytics to predict equipment failure and maintenance needs, avoiding possible incidences.
- Environmental Safety: Evaluating factors in the environment such as what factors are causing incidences in the work environment, and what risks do environmental attributes pose can help to identify most risky areas to address, creating heatmaps of safety risk.
Predictive analytics have been used to “score and rank”, and identify which rail crossings are most at risk for an incident given environmental factors such as approach, grade, location of other roads, etc., helping to prioritize action for remediation.
- 360-Degree Learning: Using post-incident data in an analytical manner can impact claim and litigation approaches, while also informing employee, environmental and equipment efforts.
This is not an exhaustive list; there are as many areas of opportunity to apply predictive analytics in Safety, as there is appetite for addressing.
Making it Happen
This analytical orientation is not a futuristic dream, this is something being done now.
We have more data than ever – big data — to support predictive analytics, including sensor data from equipment and the environment. We have the tools and techniques, including machine learning models that are always-on and continually learning as more data is brought to bear. The internal processes and culture that has been created over the past several years to improve safety exist, and can be used to deliver and deploy the predictive analytics recommendations.
While employee Safety is the primary mission of these efforts, there are secondary benefits that include maintaining business continuity, good community and corporate relations and overall achieving the business mission with less interruption.
Taking your Safety program to the next level and breaking through your current rate of improvement is possible, by moving to predictive analytics as a way of driving direct change and impact.
[1] U.S. Census Bureau and Department of Labor, Bureau of Labor Statistics