Analytics for Railroad Network Fluidity: Now More Than Ever
With supply chain issues topping recent news, the railroad industry is under scrutiny for how well they operate their networks. As a follow-up to our previous post about railroad industry operating ratio, we here consider how analytics and machine learning can help railroads improve network fluidity. A key focus of Precision Scheduled Railroading (PSR) can in some ways be summarized as “move trains faster”. This is an over-simplification, but the top key performance metrics in the industry relate to how efficiently freight is moved through their systems.
There are many ways in which analytics can help. To start out at a high-level, for example, it is possible to take a dashboard in common use at all railroads for tracking key metrics and make them forward-looking. In other words, rather than “current status” and last-N-days charts, we add forecasting analytics to project trends and patterns out for the week or even month.
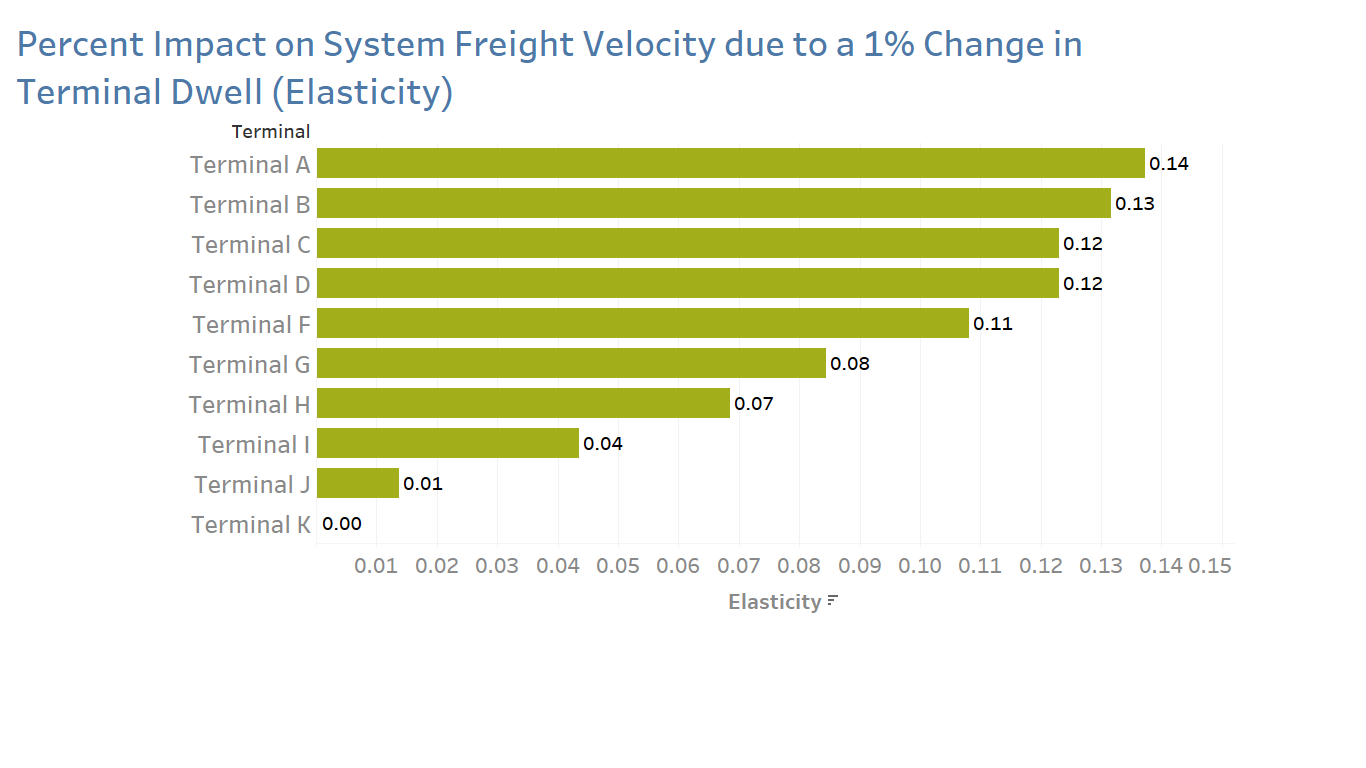
With slightly more detailed data we can produce a sensitivity analysis. See the included figure, for example, which ranks and quantifies how an improvement in a particular terminal might impact the entire network velocity. This type of analysis can extend to a variety of controllable and uncontrollable factors.
Where it gets interesting and even more useful, though, is when we get very granular to analyze network operations. As an example, a locomotive stall on the network can cause serious disruptions which can take hours, even days to work their way out of the system. See this case study for one example of how this works.
Our solution for Adverse Network Events is a broad approach to build a network operation data repository designed specifically with analytics in mind. It can address a wide variety of network fluidity issues.
The railroads are data-rich but analytically poor. Is there not a better time to apply analytics?