How to Slice It: Using Optimal Reconciliation for Hierarchical and Grouped Forecasts
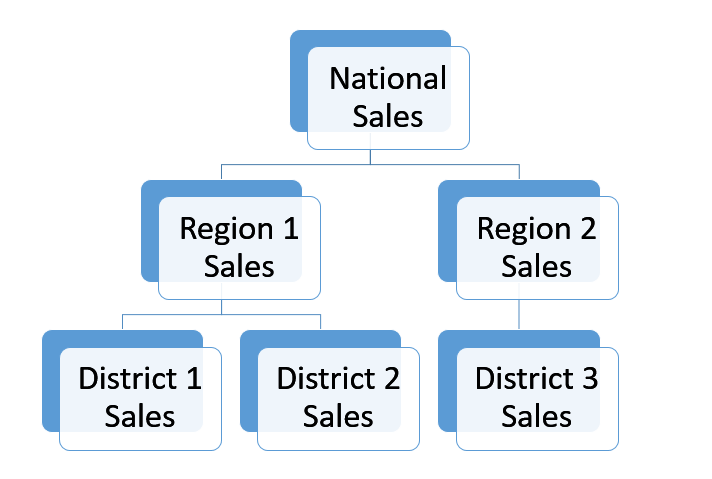
Companies use forecasting methods to plan for future demand using time series data. Often, these time series can be represented in a hierarchy. For example, products can be broken down to different levels of sales data. Figure 1 shows an example of a simple hierarchy in which the most aggregated level is “National Sales” . The next level has the sales of two different regions and the last level is the most disaggregated, with district sales. This type of hierarchical structure disaggregates in a unique way, meaning there is only one possible order for the levels of the structure.
Figure 1
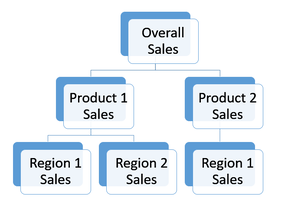
Time series data can also be represented in a grouped hierarchical structure, meaning there is not a unique way to represent the levels. For instance, Figure 2 shows a grouped hierarchical structure in which the levels of the sales data are region and product. The order of the levels for region and product can be switched, so the hierarchical structure does not disaggregate uniquely.
Figure 2
With hierarchical structures, you have to be careful about how the forecasts at each level add up. The forecasts that are made at lower levels may not necessarily add up to the forecasted total value. This can be very confusing for people who are using the forecasts. As a result, it is standard practice to require hierarchical forecasts to add up such that the sum of the forecasts equals the forecast of the sum.
There are three common reconciliation methods to accomplish this: bottom-up, top-down, and middle-out.
-
Bottom-up: independent forecasts are generated for the bottom level of the hierarchy and then aggregated to produce forecasts for the upper levels.
-
Top-down: a forecast is generated for the top level and then forecasts are disaggregated down the hierarchy.
-
Middle-out: a middle level of the hierarchy is selected and forecasts for that node are computed for that level.The forecasts for levels above the middle level are computed by aggregation, and forecasts for levels below the middle level are computed by disaggregation.
However, these approaches rely entirely on the forecasts from just one level of the hierarchy and as a result, fail to utilize all the available information.
Better methods are available. SAS has developed algorithms for “efficient” hierarchical reconciliation, available in the HPFReconcile procedure and in Forecast Server. There are also packages in R to perform intelligent reconciliation. For a recent forecasting project, First Analytics used a package developed by Hyndman to do just that.
Hyndman, Ahmed, Athanasopoulos, & Shang (2011) developed a method that they call “optimal reconciliation”, which handles forecasts for grouped or hierarchical structures. First, independent forecasts are generated for all nodes at every level of the hierarchy, and then an optimal reconciliation step is used to adjust the forecasts. The reconciled forecasts are a weighted sum of the forecasts from all nodes, where the weights are found by solving a system of equations with an aggregation matrix that indicates the node relationships throughout the hierarchy. Hyndman et. al. show that with some reasonable assumptions, this system simplifies and can be solved in the same way as linear regression. In their empirical comparisons, the authors showed that the optimal reconciliation approach tends to give more accurate forecasts than the bottom-up, top-down, and middle-out methods.
Few companies are using these intelligent forecast reconciliation methods in practice, but that may change as awareness grows. Even in the well-established practice of forecasting, there is room to compete on analytics.
References
Trovero, Joshi, & Leonard (2007). Efficient Reconciliation of a Hierarchy of Forecasts in Presence of Constraints. SAS Global Forum. http://firstanalytics.com/wp-content/uploads/attachments/277-2007.pdf
Hyndman, R.J., Ahmed, R.A., Athanasopoulos, G. & Shang, H.L. (2011). Optimal Combination Forecasts for Hierarchical Time Series, Computational Statistics & Data Analysis, 55(9), 2579–2589.