Simpson’s Paradox and Safety Analytics
We previously wrote about Goodhart’s law and how it poses a challenge to analytics over a period of time in the sense that “when a measure becomes a target, it ceases to be a good measure.” But that is not the only quirky phenomenon named after a researcher that can get in the way of reliable analytics.
Simpson’s paradox is the notion that an effect or relationship that appears within groups vanishes or even reverses when those groups are combined. This can be a trap for those who casually and naively approach data analytics.
As an example, one of our safety analytics clients was interested in learning whether so-called “safety observations” were having an impact on reportable injury rates. This was not a “big data” exercise; data was available in small spreadsheets and dashboards. General corporate managers could see what they believed was a substantial impact of safety observations when looking at all operating regions as a whole. Therefore they advocated for increased safety observations.
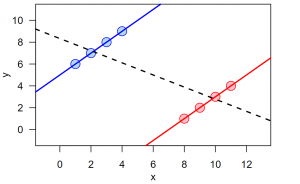 Others were skeptical. While observations are a good practice to improve safety, very large increases in them, both recent and proposed, left some believing that other, potentially more powerful safety interventions might be neglected. In fact, when field managers within the regions would look at their own data, they did not perceive what corporate management was asserting. The graph shows that a relationship can exist within groups (red and blue circles and lines), but when taken as a whole, the relationship (dotted line) is a different direction and magnitude.
What to do about this? First, data literacy is important. That is recognizing that phenomenon like this exist. Then, taking additional time for high- and low-level data analysis. Second, understanding that confounding factors (other correlated variables) may be obscuring true relationships. And finally, valuing the usefulness of formal statistical modeling as a remedy. This is because statistical models, if appropriately structured, can account for grouping phenomenon. They can also incorporate confounding factors.
We have seen this in applications beyond safety, most recently, in our work modeling the pandemic.
Safety analytics is a powerful tool to help keep people safe. But as is often the case in all kinds of data analysis, simple summaries and cursory reviews have pitfalls.