Three Tools to Better Quantify the Savings from Locomotive Fuel Conservation Technologies
Fuel savings technologies, such as top-of-rail friction modifiers or solid stick wheel flange lubrication, offer the prospect of savings millions of dollars in fuel cost. At the same time the investment is also in the millions of dollars. Putting a number to the savings is notoriously elusive. Why not avail yourself of some analytical tools to help support a decision that has such a large potential upside?
Here are three approaches to overcoming the challenges of quantifying the effects of a particular technology.
1. Create a Reliable Fuel Metric.
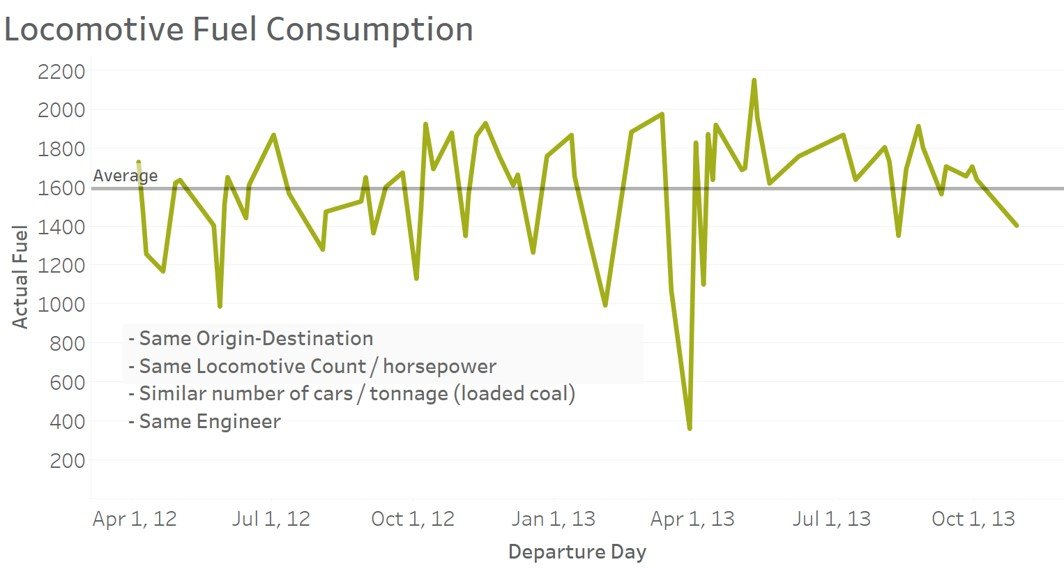
Fuel measurement data is famously messy and can be derived from various sources, often in conflict with each other. See, for example, the figure. This consumption data from daily trips on a single run varies from under 400 gallons to over 2100. Yet the trip profiles are nearly identical: same locomotive count and horsepower; similar number of cars and trailing tonnage; even the same engineer, with his/her unique throttle positioning profile.
With such large variation in measurement, detecting a low, single-digit percent savings, is difficult. It’s a signal-to-noise issue: trying to isolate a small but significant effect from data driven by multiple factors, outside of the large unexplainable variation.
We have developed a method for cleaning and stabilizing fuel measurement data. See, for example, this overview and the benefits it brings.
2. Test with scientific rigor
Too many tests go like this: install the technology on a few locomotives and run them for a few weeks. This will invariably produce results that are not definitive nor actionable. Instead, spend time conducting more rigorous tests.
One method can be very controlled, like conducting runs at TTC. See, for example, this report. A criticism of TTC tests is that they are too controlled, and do not reflect the realities of a particular railroad’s profile. This too, can be addressed through analytics, such as in this report.
Outside of TTC, railroads conduct field tests on selected trips. But selecting the trips also needs analytical rigor. The variation in the data dictates how much of a sample size you will need to be confident in the effect you estimate. Tools such as formal Design of Experiments tells you how many trips you will need to be confident at a certain level. And other test design practicies suggest how to balance the difference between test trains and trains running without the technology, to make even more distinct comparisons.
3. Use statistical models
There are a number of statistical tools that can be used to develop a final estimate of fuel savings. See again this report. These tools, especially when used in combination, can triangulate to give a more confident estimate of the impacts. They can also assign a degree of certainty.
Use all three in combination
In addressing the issue of uncertainty in fuel savings estimates, these tools all need to be used. Start with the reliable, less variable metric. Carefully design and execute the test (the latter is hard to do, and very important). Finally, use the estimation tools to be more assured of your results.
For an example of some of these tools at work, check out this case study. Also check out our solution for fuel conservation for rail and trucking.